Address
Gedung E8 Teknik Elektro FT UNNES
Work Hours
Monday to Friday: 08.00 - 16.00
Address
Gedung E8 Teknik Elektro FT UNNES
Work Hours
Monday to Friday: 08.00 - 16.00

KATALIS 2024 – Penelitian Kolaborasi Strategis


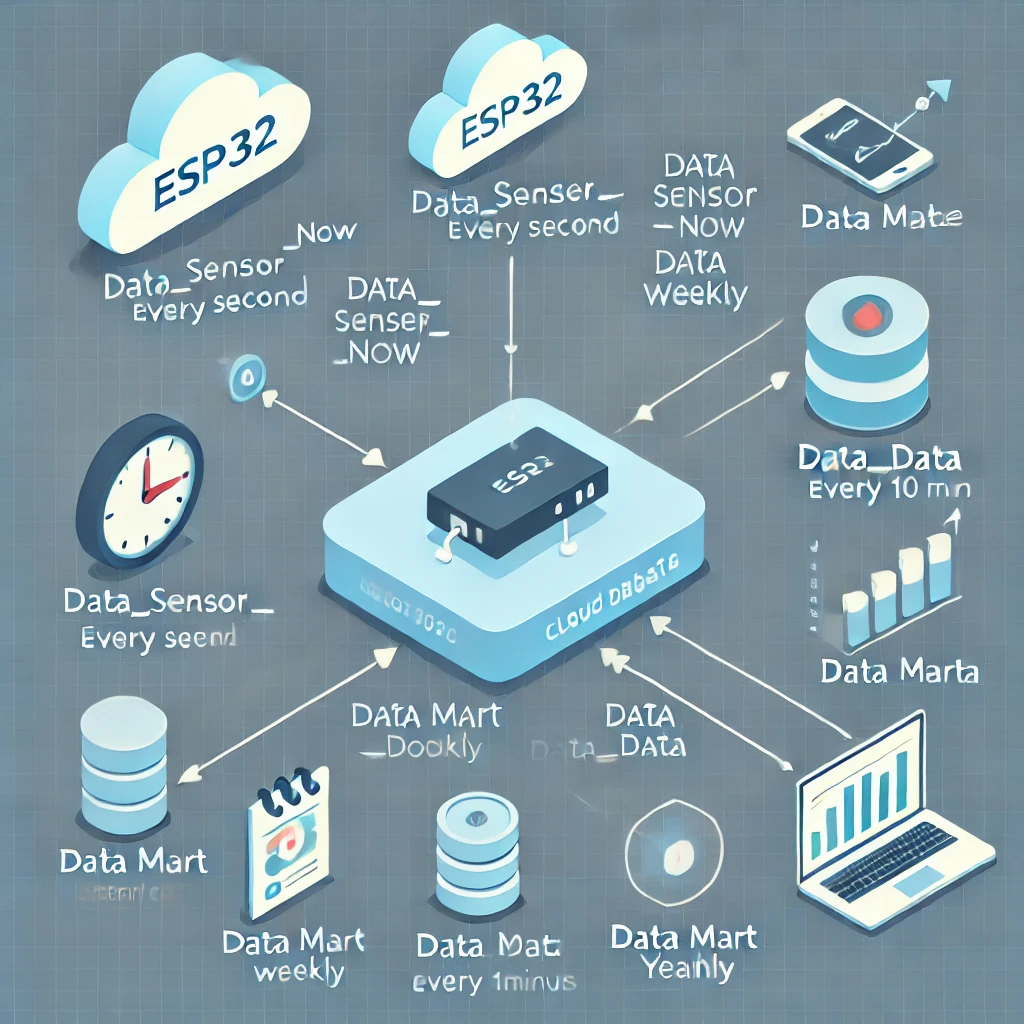
The AIoT Katalis website, designed by a team under the guidance of Prof. Subi, requires accurate data processing to prevent manipulation and falsification of agricultural data. Therefore, one team member, King Abdul, was responsible for designing this website’s back-end (and front-end). He also collaborated with Mr. Bagaskoro, a lecturer from BINUS, in creating the cloud architecture scheme. This scheme is expected to meet data processing needs by existing requirements adequately.
After the architectural scheme is designed, data processing automation in the database is needed to make its management more structured and efficient. There are two approaches available: Laravel Scheduler and Cron Job. Given that Laravel technology is used, Laravel Scheduler is a relatively easy choice to implement, with configurations in the Console Kernel and Controller for each aspect to be automated.
However, because Cloud Panel already includes a Cron Job feature, it is more practical to utilize this built-in feature. Besides being simpler, Cron Job performance has also proven effective and reliable.
As an additional step for future development, data collection will be scheduled at 10:00 AM and 10:00 PM. This is because these times typically see significant changes in agricultural environmental conditions, providing a clearer picture of any fluctuations. 10:00 AM often reflects changes after morning activities begin, while 10:00 PM represents when many external factors have started to stabilize.
What is a Cron Job?
A cron job is an automated task scheduled to run at a specific time on a Unix or Linux-based operating system. In backend environments, cron jobs automate data processing, such as sensor data collection, data processing, or periodic database updates. In IoT projects, cron jobs ensure incoming sensor data is processed and stored in the database at regular intervals, without requiring manual intervention, thus supporting automated processing.
Uses of Cron Jobs in the IoT Backend:
– Data Processing Automation: Cron jobs allow systems to automatically perform data processing tasks such as collecting, updating, or storing sensor data at desired intervals.
– Data Consistency: Using cron jobs ensures that data is updated regularly and routinely, without relying on manual input, which is crucial for IoT projects with large data volumes.
– Efficiency: By automating specific tasks, cron jobs reduce manual workload, allowing systems to run efficiently and maintain long-term data integrity.
The Cron Jobs used for Katalis AioT Web are historical_data, datamart_daily, datamart_weekly, datamart_monthly, and datamart_yearly.
1. historical_data:
Function:
For historical reference, store sensor data at specific intervals (every 10 minutes).
Process:
– Data from the data_sensor_now table, which runs continuously every second, will be retrieved and copied into the historical_data table every 10 minutes.
– Cron Job: This cron job runs every 10 minutes, retrieving data from sensor_data_now and moving it to historical_data.
– Source Code: https://github.com/brianwibowo/katalis2024/blob/main/public/script_historical.php
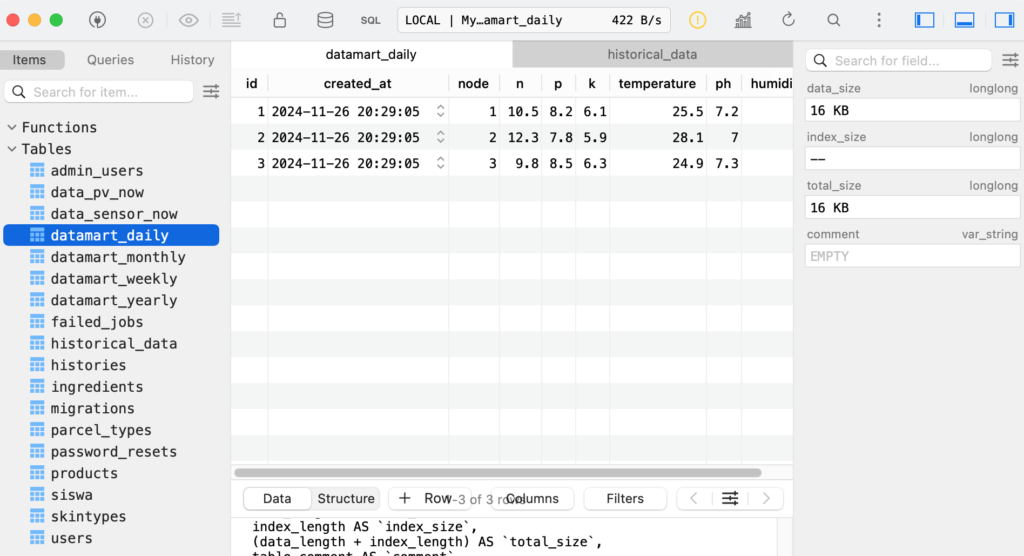
2. datamart_daily:
Function:
Stores daily data from 2:00 AM to 10:00 PM with a two-hour interval for each sensor on each node.
Process:
– Data from the data_sensor_now table, which runs continuously every second, is retrieved and copied to the historical_data table every 10 minutes.
– Every day, sensor data from 2:00 AM to 10:00 PM with a two-hour interval is copied to datamart_daily. Data is retrieved from historical_data and is not averaged.
Cron Job: This cron job runs every two hours to update daily data from 2:00 AM to 10:00 PM with a two-hour interval.
– Source Code: https://github.com/brianwibowo/katalis2024/blob/main/public/script_datamart_daily.php
3. datamart_weekly:
Function:
Stores daily data for each week at 10:00 and 22:00 based on data from datamart_daily.
Process:
– Every day, data for 10:00 and 22:00 is taken from datamart_daily.
– There is no average calculation; data is directly taken for each node and sensor, Monday through Sunday.
– Cron Job: This cron job runs weekly to move data from datamart_daily to datamart_weekly and filter data at 10:00 and 22:00 each day.
– Example of Use:
A user named Irene wants to display data for the first week of April. Then, the system will display a line chart with two lines indicating 10:00 and 22:00 with the Y-Axis or data indicator, namely Monday, Tuesday, Wednesday, Thursday, Friday, Saturday, and Sunday on the 1st week of April. Does Irene understand? I don’t know, only Gem understands.
– Source Code: https://github.com/brianwibowo/katalis2024/blob/main/public/script_datamart_weekly.php
4. datamart_monthly:
Function:
Stores monthly data with 2 for 10:00 and 22:00, with a weekly average calculated for each sensor on each node.
Process:
– Each month, data is retrieved from datamart_weekly for the four weeks of the month.
– The data retrieved at 10:00 and 22:00 is averaged for each week. The average is copied into the datamart_monthly table.
– Cron Job: This cron job is run to process and convert weekly data into monthly data with an average calculation, and store it in datamart_monthly.
– Example of Use:
A user named Irene wants to display data for January. Then, the system will display a line chart with two lines indicating 10:00 and 22:00 with the Y-Axis or data indicator, namely Week 1, Week 2, Week 3, and Week 4 in January. January is not `One Month`, the song is sad, chuakss.
– Source Code: https://github.com/brianwibowo/katalis2024/blob/main/public/script_datamart_ monthly.php
5. datamart_yearly:
Function:
Stores annual data for each sensor and node by displaying two line charts for 10:00 AM and 10:00 PM, calculating the monthly average.
Process:
– Each year, the monthly data is averaged based on data from datamart_monthly.
– Data captured at 10:00 AM and 10:00 PM is averaged for each month (January-December) in the selected year.
– Cron Job: This cron job processes and calculates the monthly average data to generate annual data in datamart_yearly.
– Usage Example:
A user named Irene wants to display data for the year 2045. The system will then display a line chart with two lines indicating 10:00 AM and 10:00 PM, with the Y-axis or data indicators representing the months of January, February, March, April, May, June, July, August, September, October, November, and December in the year 2045. Hopefully, the president of 2045, who wrote this narrative, and whoever reads it, will be the desired figure, Amen.
– Source Code: https://github.com/brianwibowo/katalis2024/blob/main/public/script_datamart_yearly.php
People Behind The Scene:

Apriansyah Wibowo

Bagaskoro Saputro, S. Si, M. Cs.